
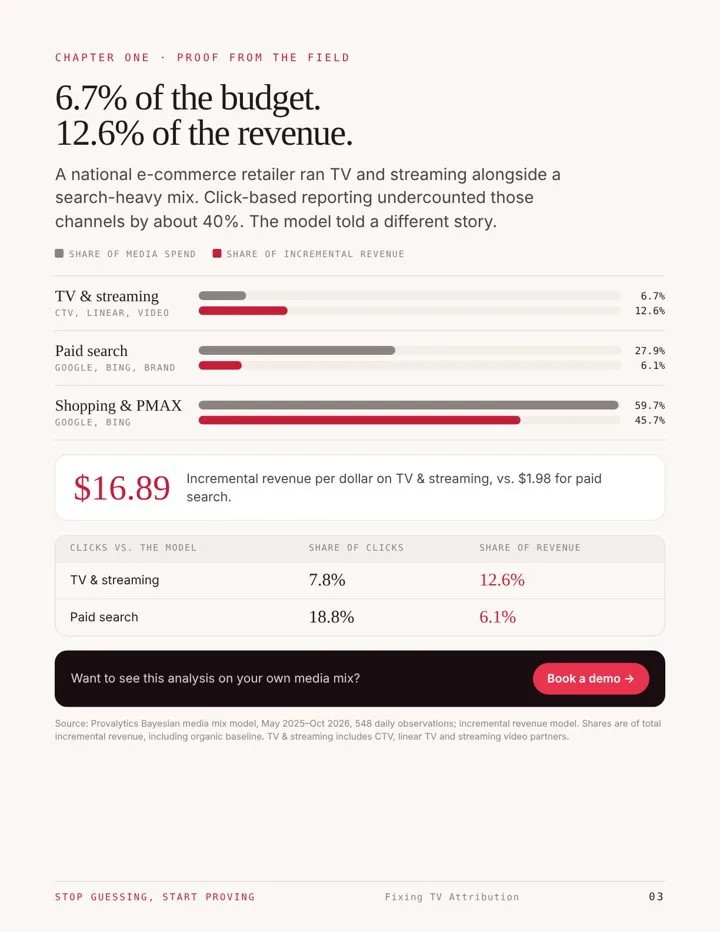
6.7% of the budget.
12.6% of the revenue.
A national e-commerce retailer ran TV and streaming alongside a search-heavy mix. Click-based reporting undercounted those channels by about 40%. The model told a different story.
Incremental revenue per dollar on TV & streaming, vs. $1.98 for paid search.
Source: Provalytics Bayesian media mix model, May 2025–Oct 2026, 548 daily observations; incremental revenue model. Shares are of total incremental revenue, including organic baseline. TV & streaming includes CTV, linear TV and streaming video partners.
One boardroom-ready argument.
- 01
Proof from the field
The spend-vs-revenue numbers, and what click-based reporting missed.
- 02
The system changed
Why the path from exposure to sale no longer lives in one dataset.
- 03
Underperformance is invisibility
What gets credited, what gets missed, and where CTV’s value actually lands.
- 04
From tracking to modeling
How natural experiments in your own campaigns isolate incremental lift.
- 05
Six new rules for measuring TV
Operating standards for CTV measurement that survives the boardroom.
- 06
What leaders actually get
Lift, halo, wasted spend, and one answer for finance and marketing.
Six new rules for measuring TV.
These are not best practices. They are operating standards for any team that expects its CTV measurement to survive the boardroom.
Measure what changed, not what was touched.
If a model cannot separate CTV’s lift from baseline demand, it is assigning credit, not measuring performance.
Stop tracking users.
Household graphs and IP matches are disappearing and were never enough. The signal is in how the system moves.
The halo is the signal.
TV rarely converts directly. It creates demand that shows up in search, direct traffic, and retail.
Separate creation from capture.
Brand search and direct traffic are outcomes, not channels. Treating them as drivers starves what creates growth.
If you cannot act now, it is too late.
A post-campaign read is not optimization. CTV needs a cadence that works while flights are still running.
One number for marketing and finance.
If they use different numbers, the system is broken. Measurement must reconcile to one defensible view of impact.
The first ninety days.
No tags, no pixels, no user-level tracking. Just your spend, delivery, and outcome data, organized into one view of performance. Typical deployment takes two to six weeks.
Map & align
Channels, CTV partners, campaigns, and outcomes structured into one system.
Set the baseline
See where TV and streaming were under-credited and where search was over-credited.
First defensible answers
Incremental lift and lag by channel, including the demand CTV creates in search and retail.
Decide in-flight
Budget moves while campaigns are still running, toward what drives impact.
See this analysis on your own media mix.
30 minutes. A live model, your TV, streaming, and search questions, and where the next dollar should go.